

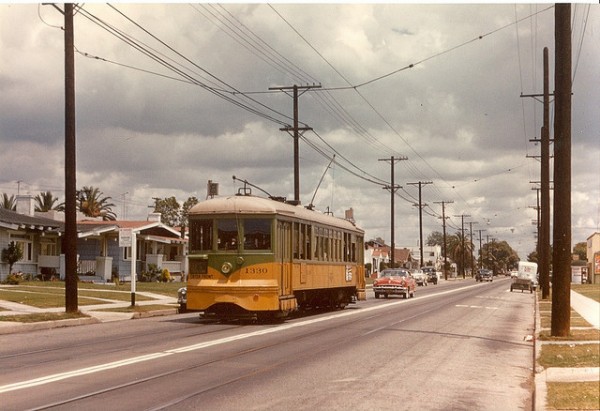
 In the early 1900s, streetcars were the dominant mode of transit in the Los Angeles area. They ran from Pomona to the ocean, and from the San Fernando Valley to Long Beach. The addition of a streetcar route to any area immediately made that land more accessible to downtown and therefore more valuable.
One of us used to live in a neighborhood near the intersection of Westwood and Santa Monica boulevards that exemplifies the sort of development spawned by the streetcar. The boulevards are lined with commercial structures and surrounded by blocks of multi-family housing, where Leah lived as a UCLA graduate student. Slightly further away from the major streets are single-family homes.
Today, we think of the streetcar’s impact on Los Angeles as a matter purely for the past. As early as the late 1910s, Angelenos began abandoning streetcars for increasingly affordable cars. The very last streetcar tracks were pulled out of the ground in 1963.
But in a very profound way, the streetcar retains a hold over Los Angeles. In recent research, we found that places near now-extinct streetcar stops remain notably denser today.
As economists who study cities and local governments, we wanted to understand how cities evolve over the long run. The project was sparked in part by a conversation we had walking down Hollywood Boulevard with an architect friend who pointed out some still-visible influences of the streetcar. How much of a city’s development can be explained by market forces? And how much is due to the long reach of the past?
To answer these questions, we calculated the shortest distance to the now-extinct streetcar for each of Los Angeles County’s 2.3 million properties. We then assigned to each property the population density of its neighborhood, and sorted properties by their distance to the streetcar.
Now look at the figure below. Take the first 400 properties—those closest to the streetcar. For those 400 properties, we find the average population density and average distance to the streetcar. This is the left-most blue dot in the below picture. Each subsequent blue dot reports the average for the next 400 properties by proximity to the streetcar.
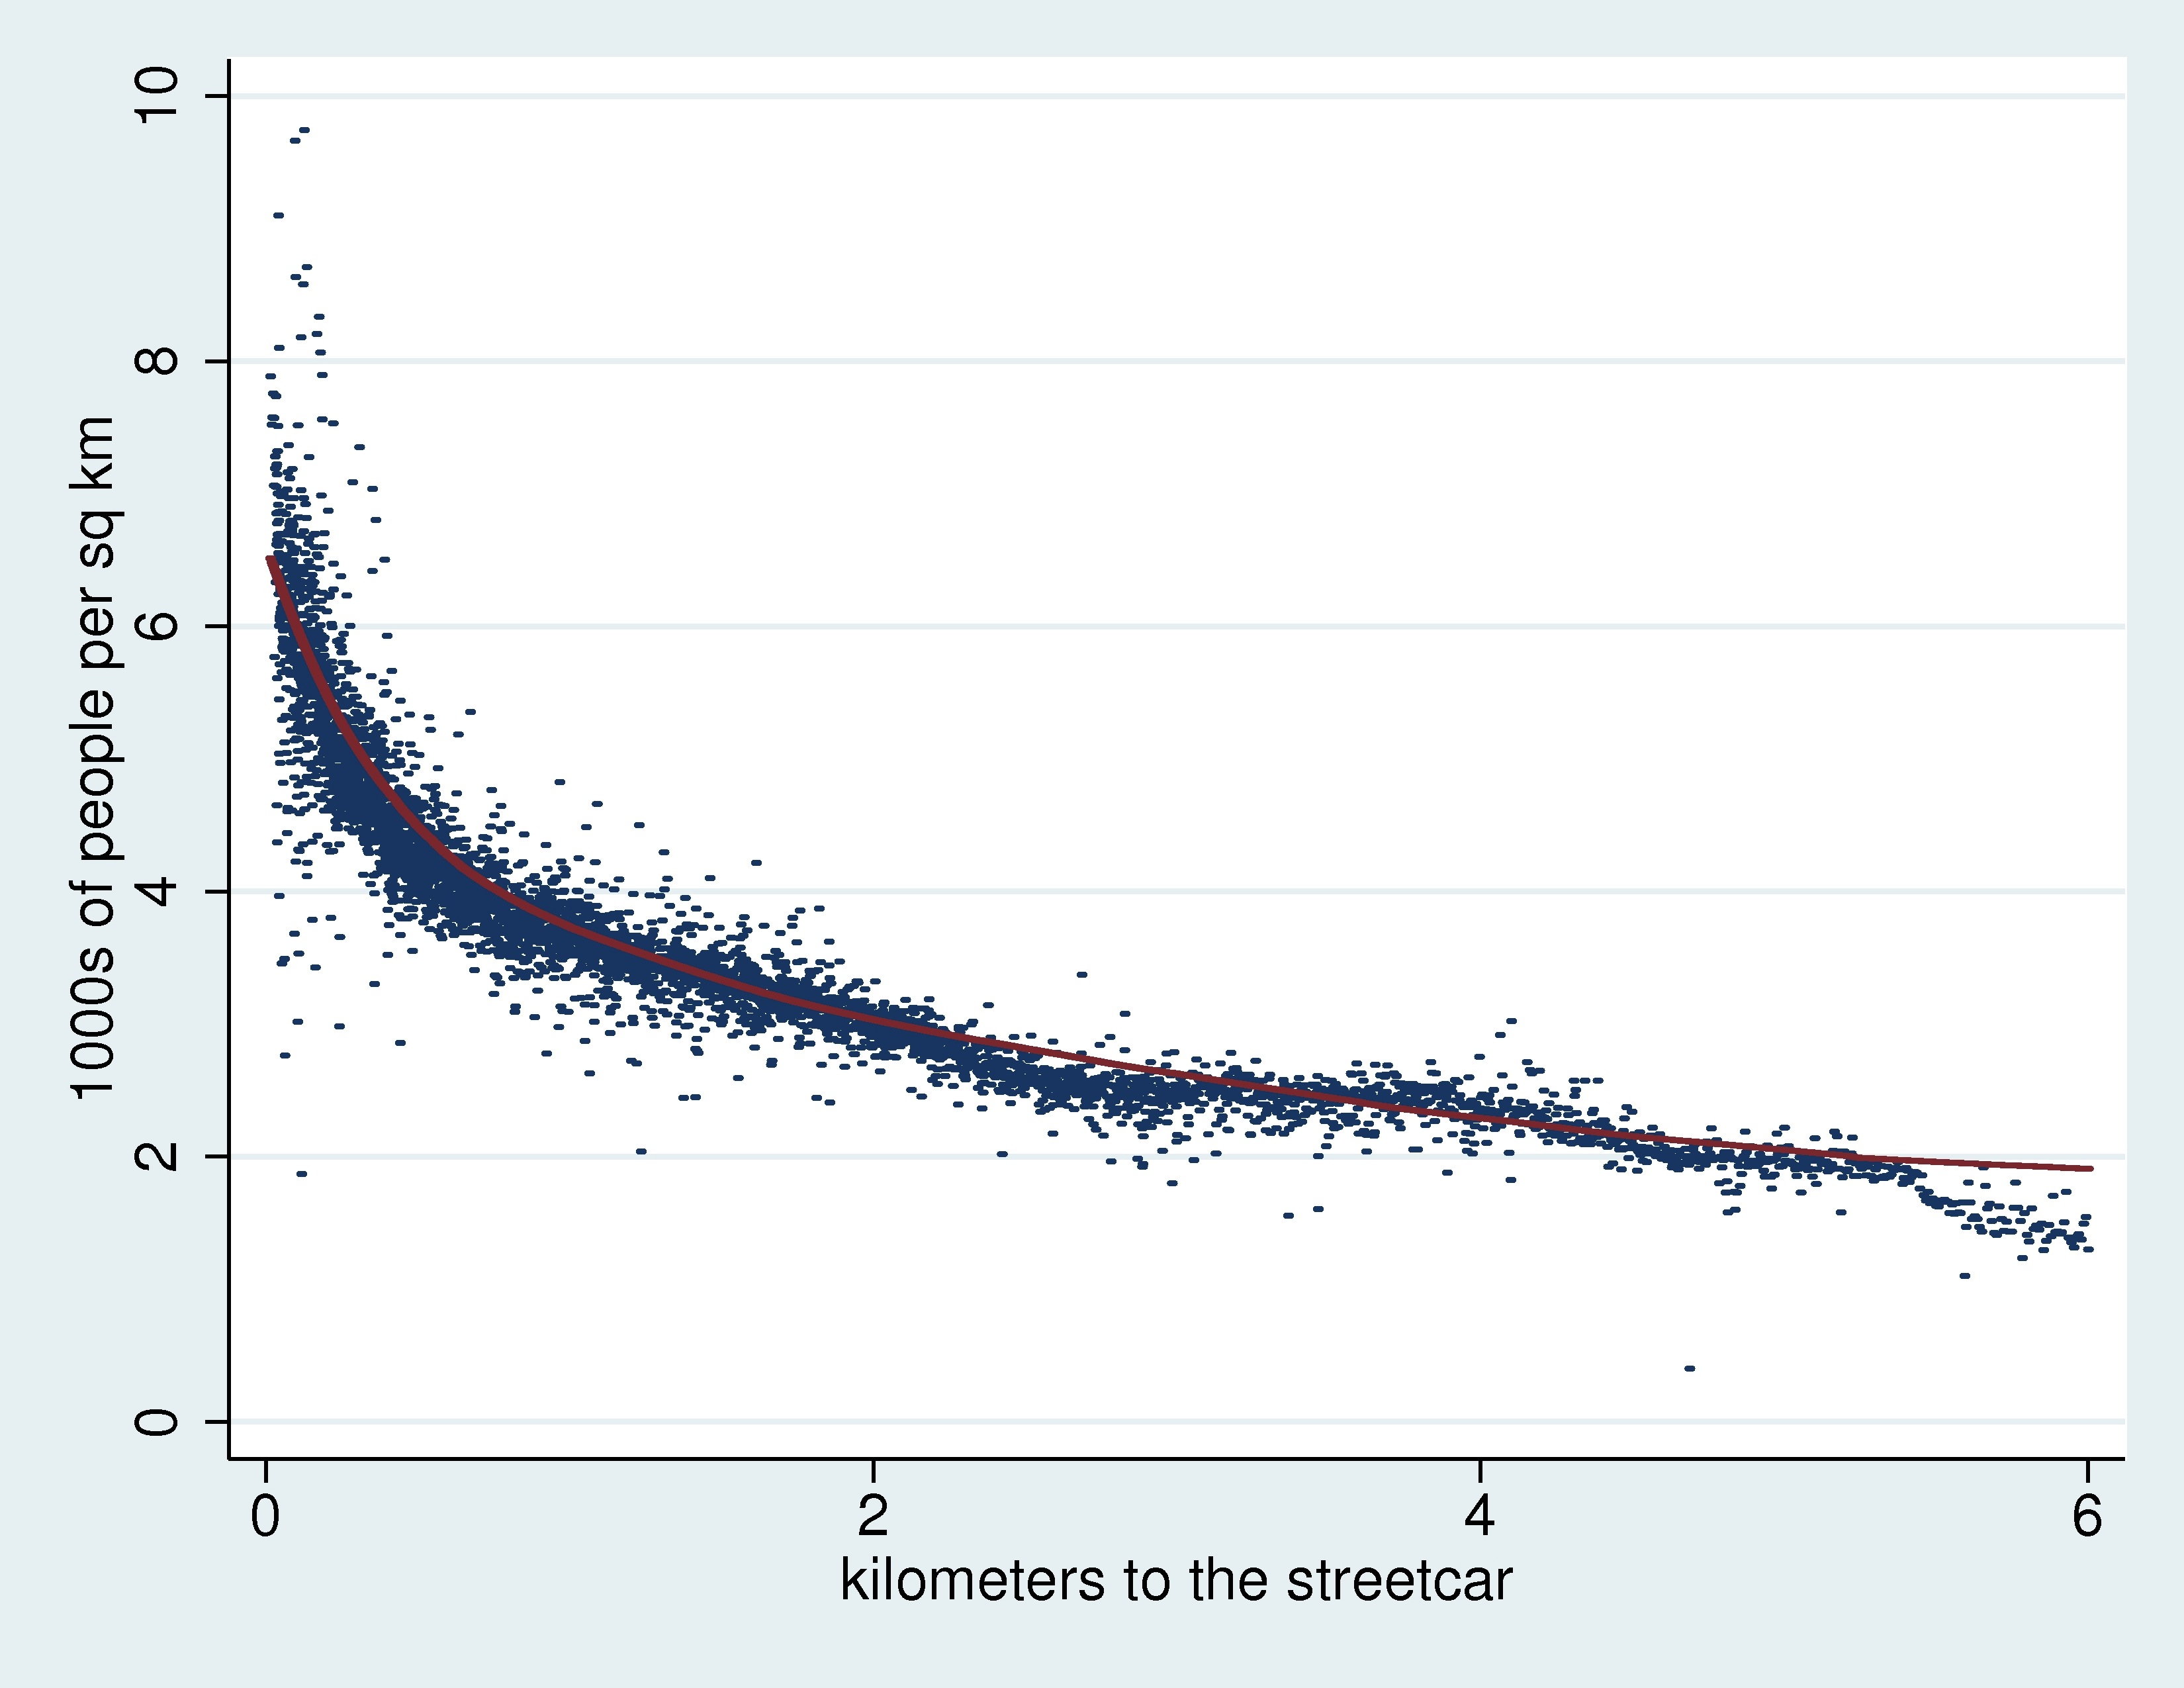
The 6,000 blue dots in the picture draw out the close relationship between current population density and distance to streetcar stops. Locations less than half a kilometer from the extinct streetcar are more than twice as population-dense as locations two kilometers from the extinct streetcar.
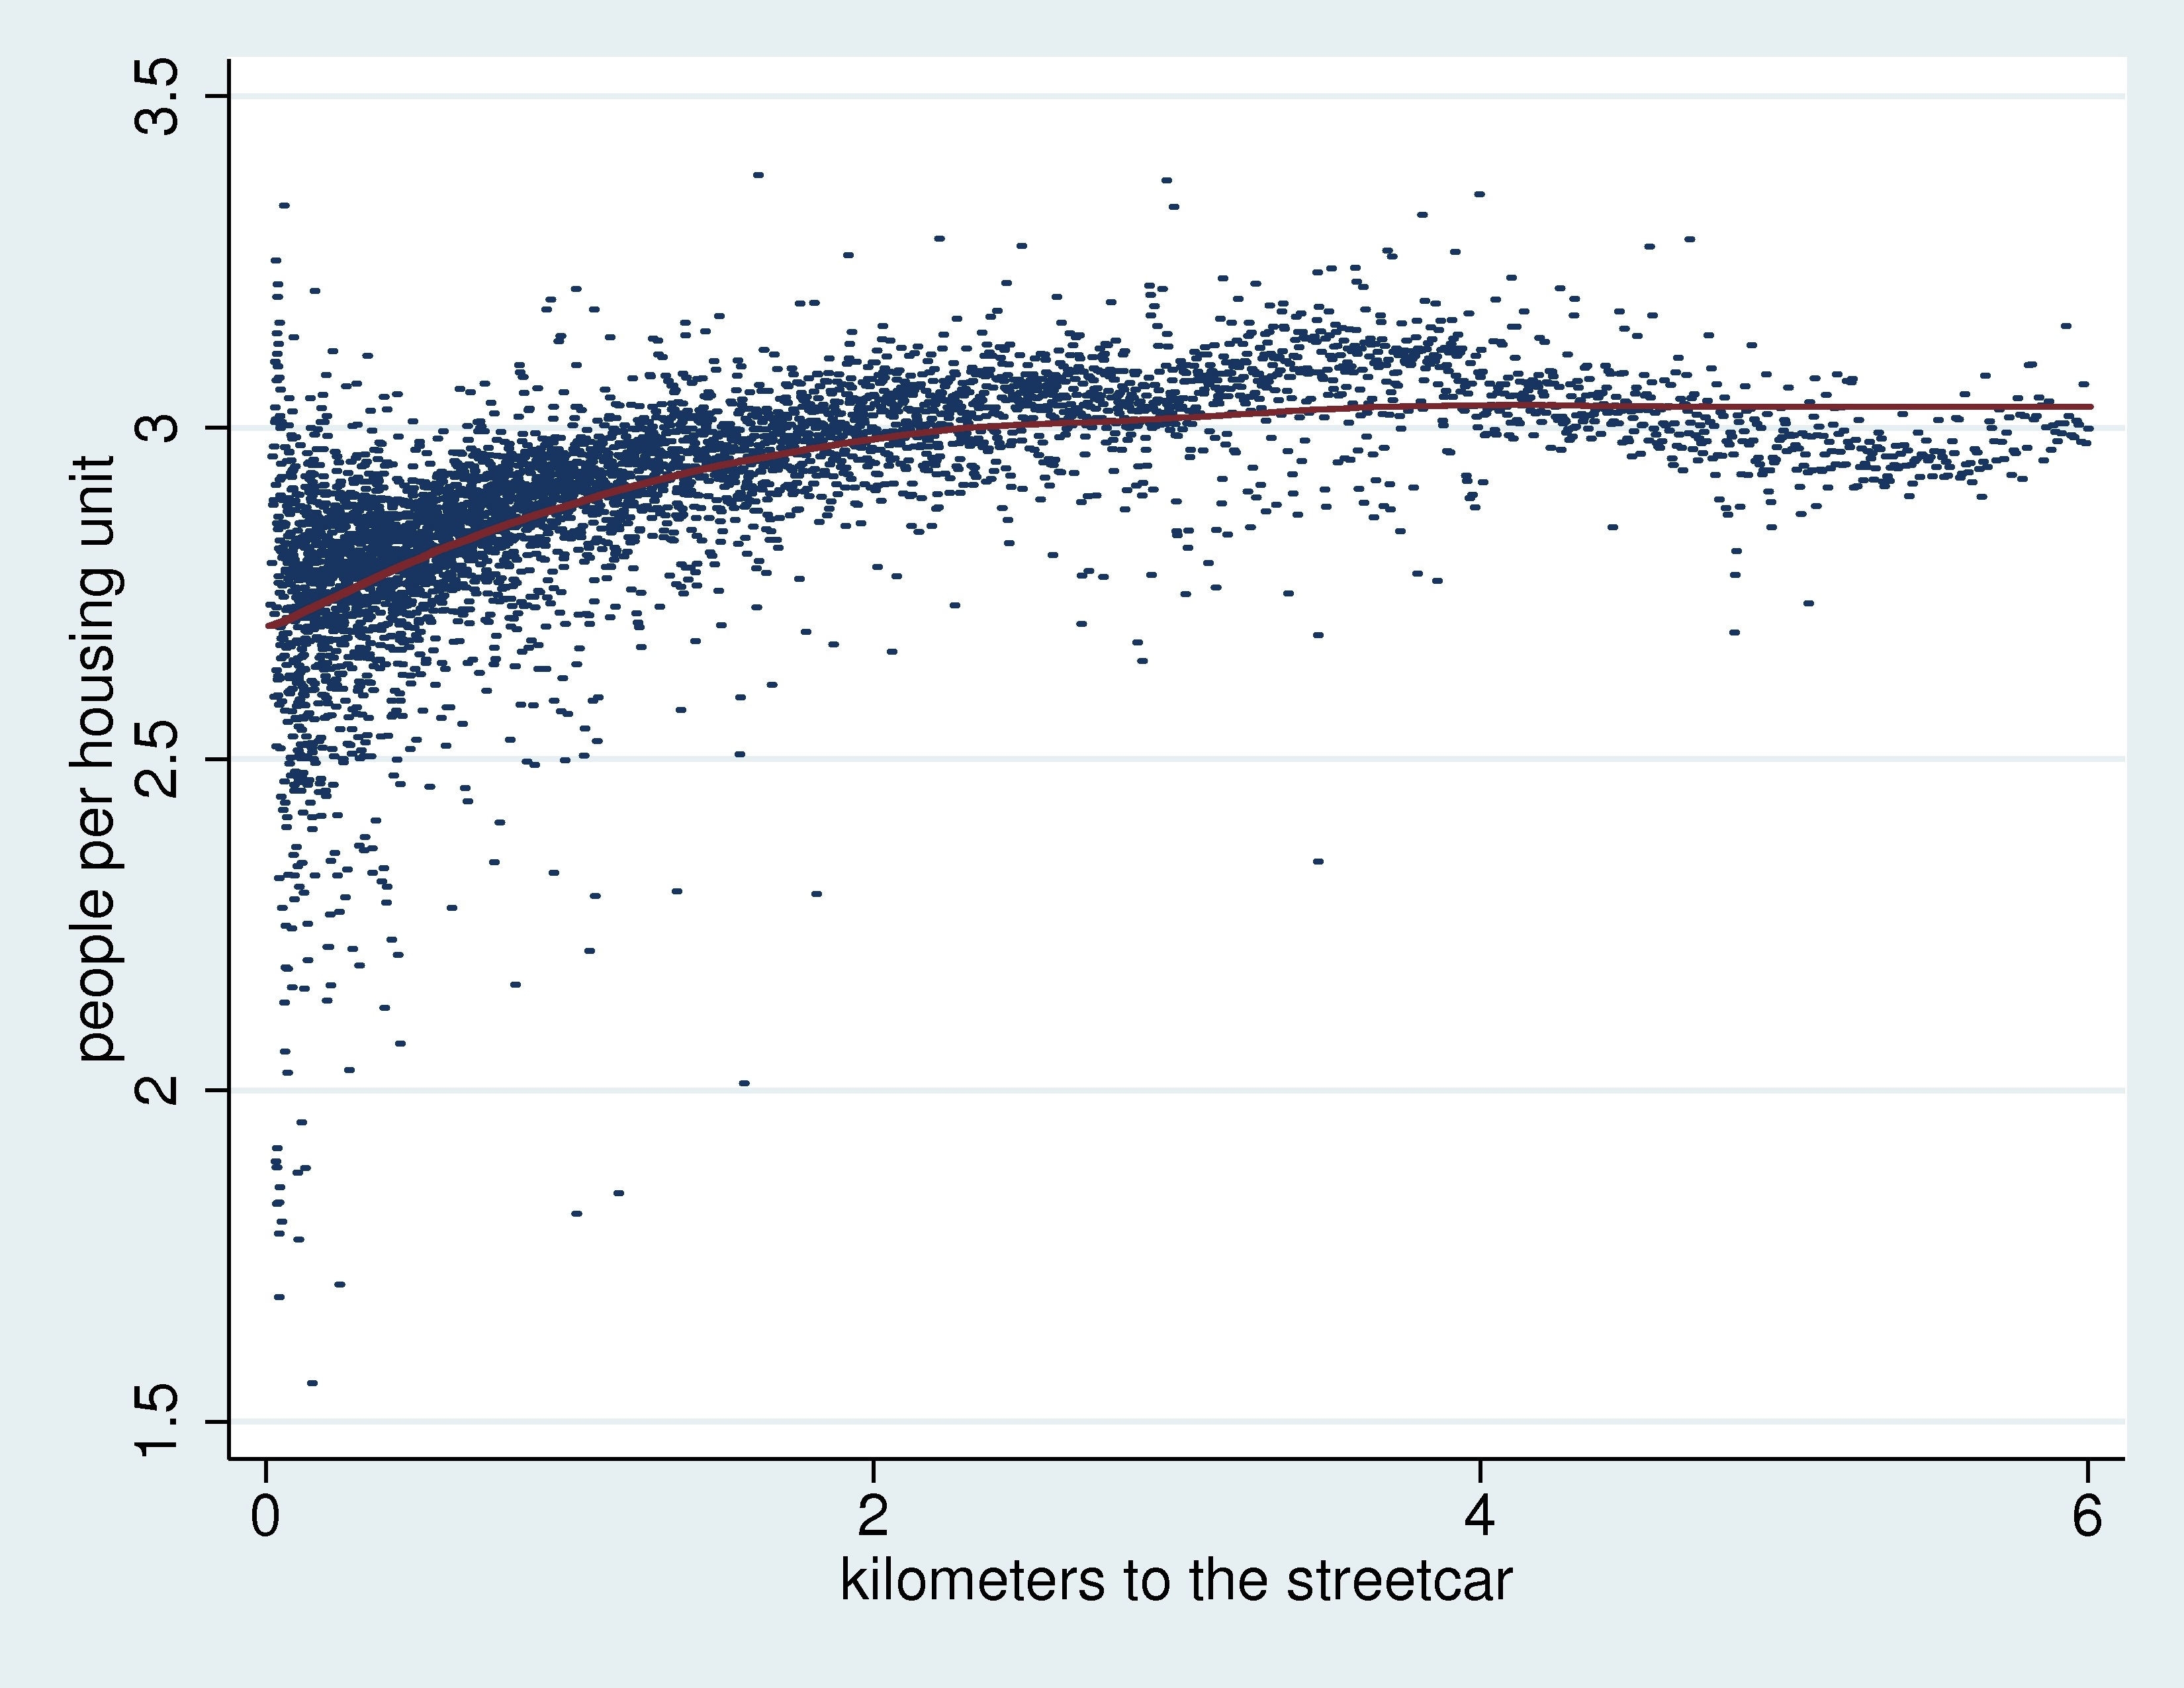
Does this density come from many people in each housing unit, or from having many units—apartments or houses—on a piece of land? The figures below—using the same analysis as the one above—show clearly that population density near streetcars comes from having many housing units on land, not from having more people per housing unit.
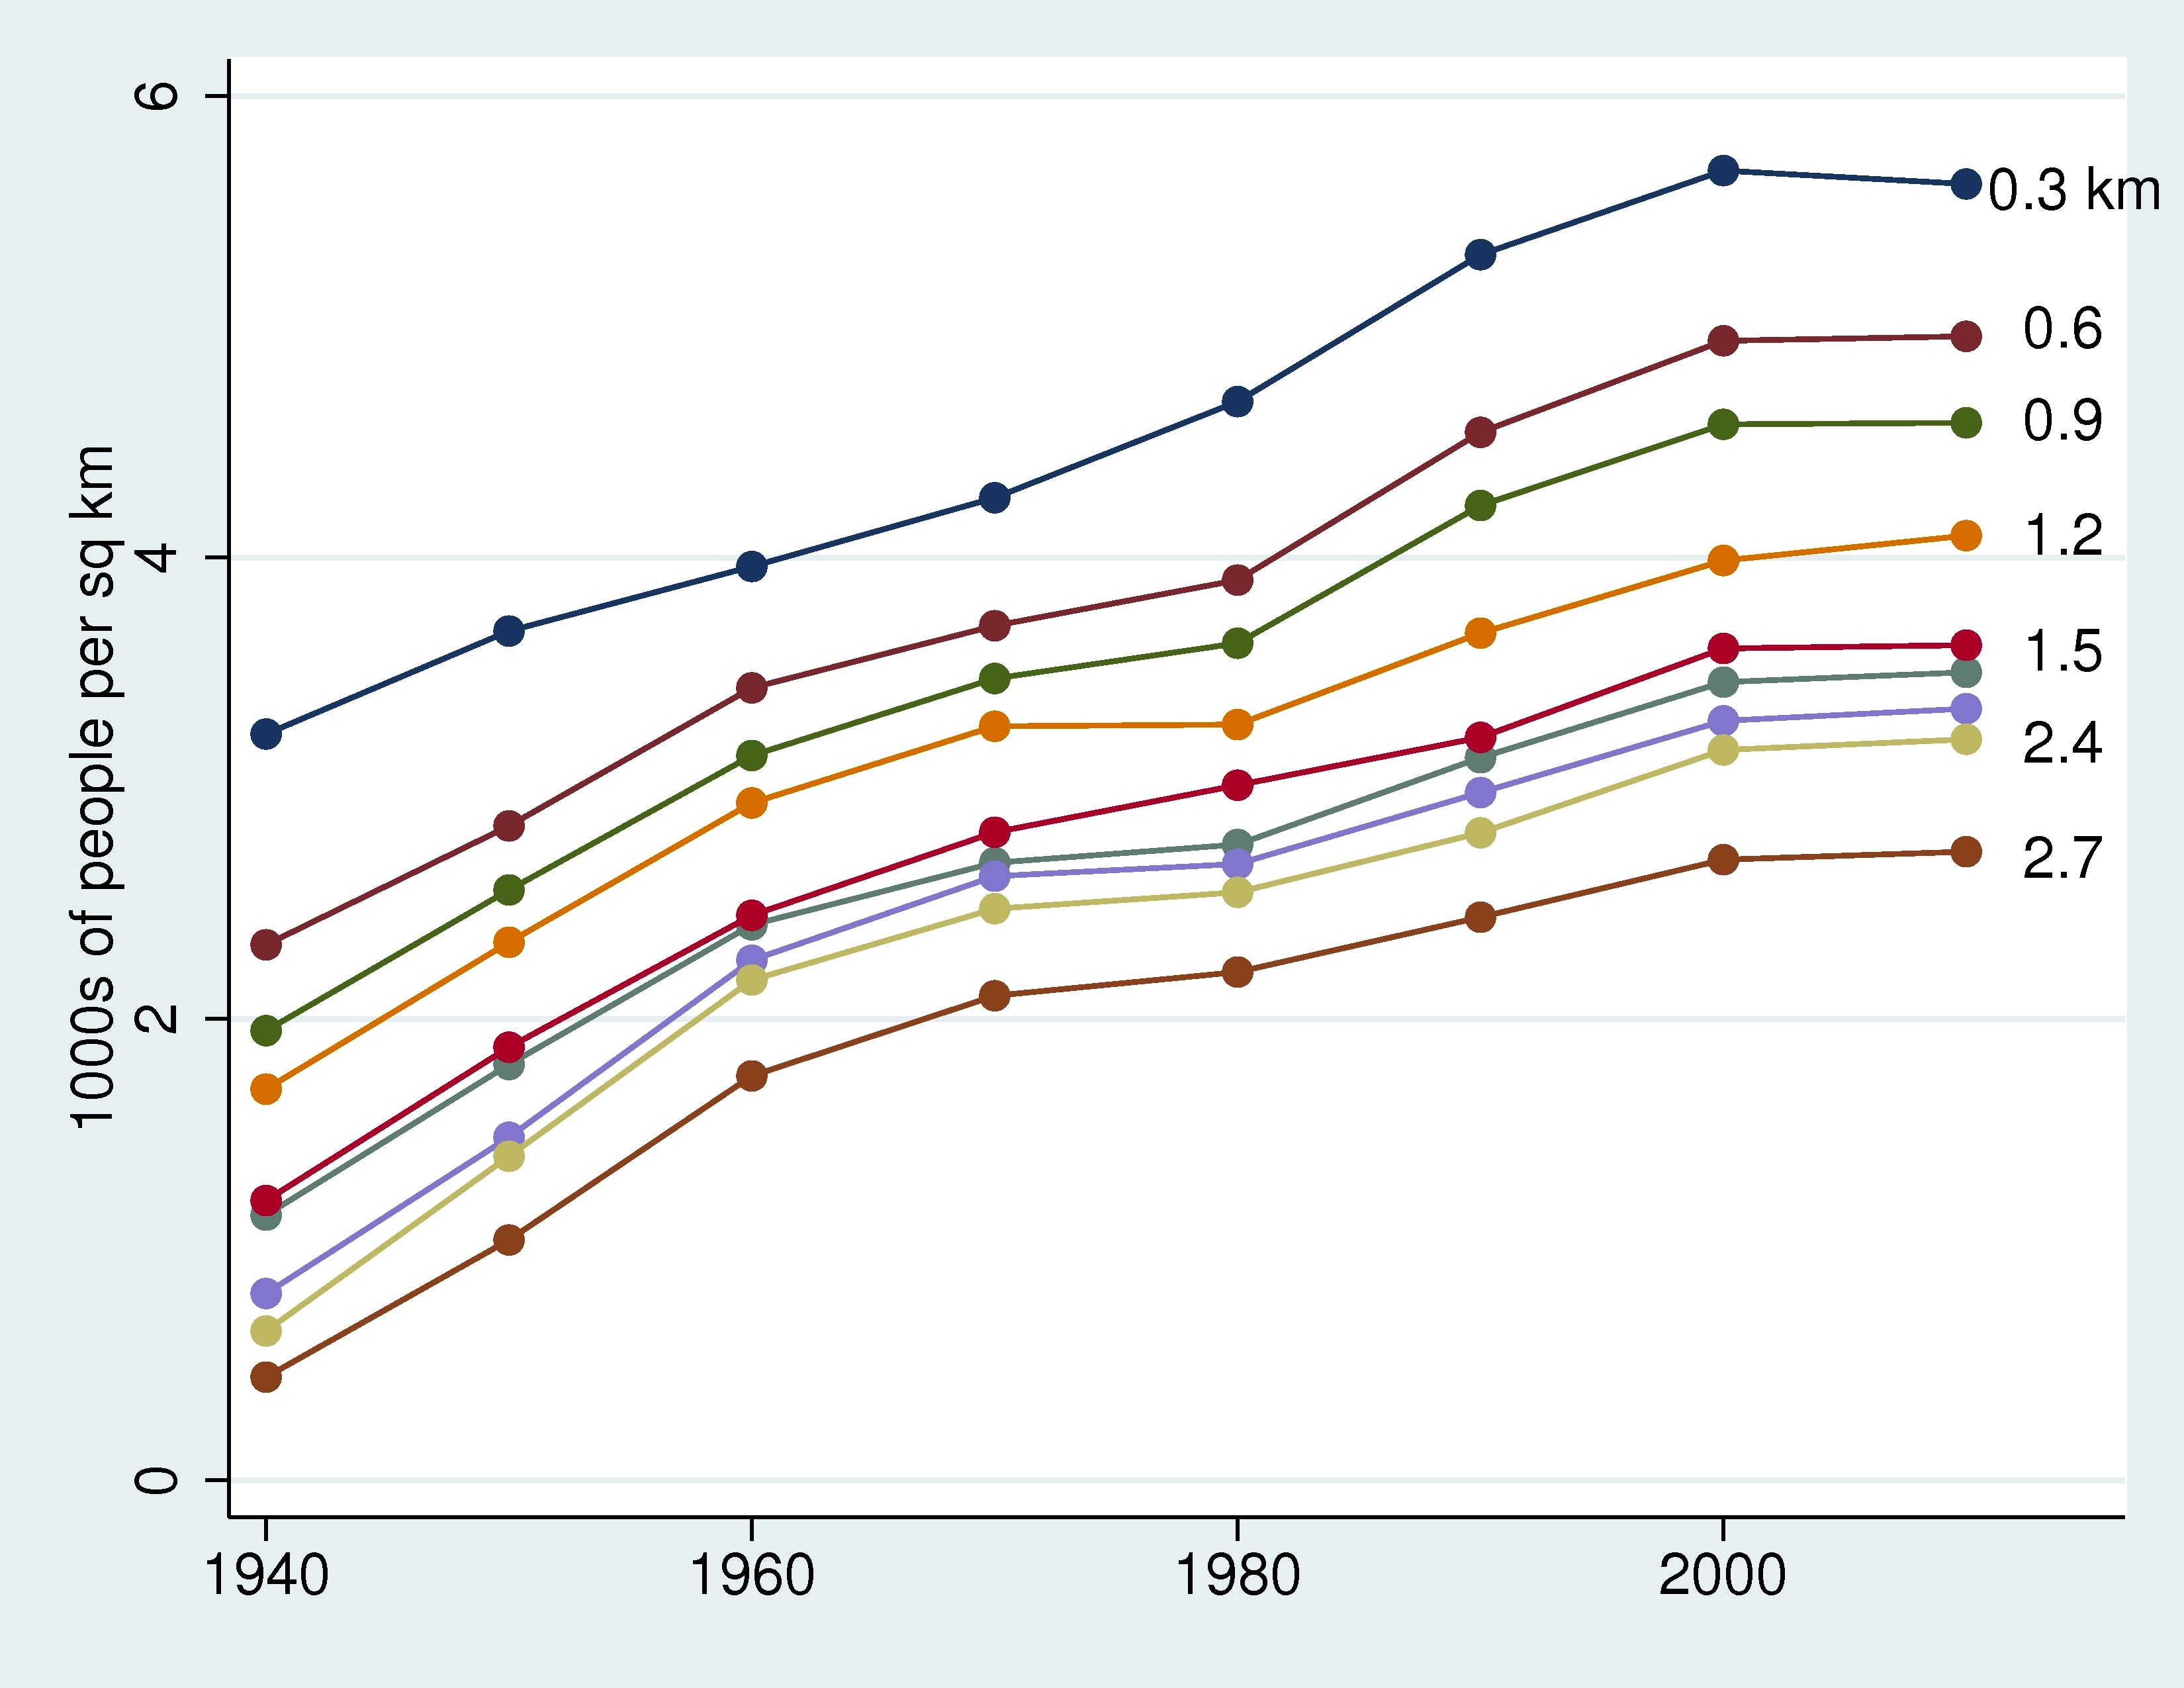
Using neighborhood-level Census data going back to 1940, we found that L.A. County is denser than it used to be, but that places near streetcars were denser then—and remain denser now.
You can see this in the figure below. The top line traces population density at 0.3 kilometers from streetcar routes between 1940 and 2010. In 1940, places very close to streetcar routes have somewhat more than 3,000 people per square kilometer; today these areas have just under 6,000 people per square kilometer. But the difference in population density between places very close to streetcar routes and those farther away (2.7 kilometers) has remained the same from 1940 to 2010—a difference of about 3,000 people per square kilometer.
Why, after almost 100 years and the addition of literally millions of people to the metro area, does the population density of neighborhoods still reflect the extinct century-old transportation system?
One explanation is that streetcars were built in particularly nice places—and that this niceness, and not the streetcar, caused and continues to cause the density. But when we used statistical techniques to correct for this, we found that things specific to where the streetcar was located, such as the distance to a major road, or the location of modern transit nodes, account for only about one-third of what you see in the pictures above.
An alternative explanation for the density near streetcars is lingering old structures. In this explanation, places near the streetcar are getting less dense, but it’s a slow process as new, smaller and shorter structures replace older, larger and taller ones. Figure 6 above hints that this isn’t likely to be the case, since everywhere gets denser over time. When we look directly at whether old or new buildings near the streetcar are constructed more densely, we find no difference.
This leaves two remaining potential culprits for the density at extinct streetcars: land use regulation and the self-reinforcing economic benefits of density, which economists call agglomeration.
Both of these explanations suggest that near the streetcar we should see more clustering of businesses or dense residential construction, and regulations that allow greater density. And this is just what we find. Places near the streetcar are roughly 45 percent more likely to be in non-residential use, and are 40 percent more likely to be zoned non-residential. For residential properties, the zoning of land near the streetcar allows 25 percent more units.
In fact, we found that the correlation between streetcars and density can be explained almost entirely by the correlation between streetcars and zoning. About half of the density near streetcars comes from properties near the streetcar having zoning designations that do not appear far from the streetcar, or vice versa. The rest of the difference between properties near and far from the streetcar comes from a different distribution of the same designations. For example, areas near and far from the streetcar may both be zoned for some multi-family residential units, but the area near the streetcar is zoned more heavily this way. In short, once we account for zoning, there is no difference in density between properties near and far from the streetcar.
Is this zoning pattern a relic of the past, too? Los Angeles had its first zone code in 1922, well after the streetcar’s heyday. Using the digitized 1922 zone map, we see that 1922 zoning allowed more construction at places near streetcars. This means that when zoning appeared, it codified what was already happening on the ground.
But we also learn that zoning has changed—about 30 percent of properties have a different zoning designation today than in 1922. Of those properties that did change, about two-thirds changed to a designation that permits less dense construction. However, all of these changes in zoning are uncorrelated with distance to the streetcar and therefore have no impact on the relative leniency of zoning near streetcar stops.
It’s hard to draw firm conclusions about what this tells us. Some economists view zoning as a requirement to build things people would not otherwise build in the absence of the regulation. Others argue that zoning is simply window dressing: the outcome of a political process in which cities yield to their constituents’ demands.
If zoning is a hard and fast rule, then it could cause density near streetcars. If zoning is, instead, just the outcome of political or economic maneuvering, then we care about the underlying politics or economics that drive the density we see. We can’t distinguish between these two explanations, and certainly the possibility remains that other forces are changing zoning.
So perhaps the real culprit behind zoning change and density is agglomeration, which economists use to explain, for example, why businesses continue to locate in Manhattan, even though the real estate is so expensive. Businesses could benefit from locating near other businesses, sharing customers or even parking lots. And when people move into apartment buildings near others, they can enjoy more coffee shops and restaurants.
But if agglomeration is causing density along old streetcar routes, it’s probably not the kind of creative-type agglomeration of which Richard Florida sings praises. Florida has championed a view of cities in which growth is created by a creative class, made up of highly educated workers, artists and bohemians, whose interactions spawn innovation. As far back as we can measure (1950), relatively lower income people live close to the extinct streetcar.
Although it’s tempting to think of the built city as a record of the past, we know that not all of the past gets preserved. The clear imprint of the old streetcar on today’s city tells us that regulation and economic forces worked together to ensure the past informs the present.
Bryon Lutz is an economist at the Board of Governors of the Federal Reserve. Leah Brooks is an economist and assistant professor at the Trachtenberg School of Public Policy and Public Administration at the George Washington University. Brooks’s work was funded in part by the Lincoln Institute of Land Policy, and the City of Los Angeles’s Planning Department helpfully provided the 1922 zoning map. This work is that of the authors and does not indicate concurrence by the Board of Governors of the Federal Reserve.
Thinking L.A. is a partnership of UCLA and Zócalo Public Square.
This was originally published by Zócalo Public Square on September 23, 2014.
*Photo courtesy of Metro Library and Archive.


